Week #18
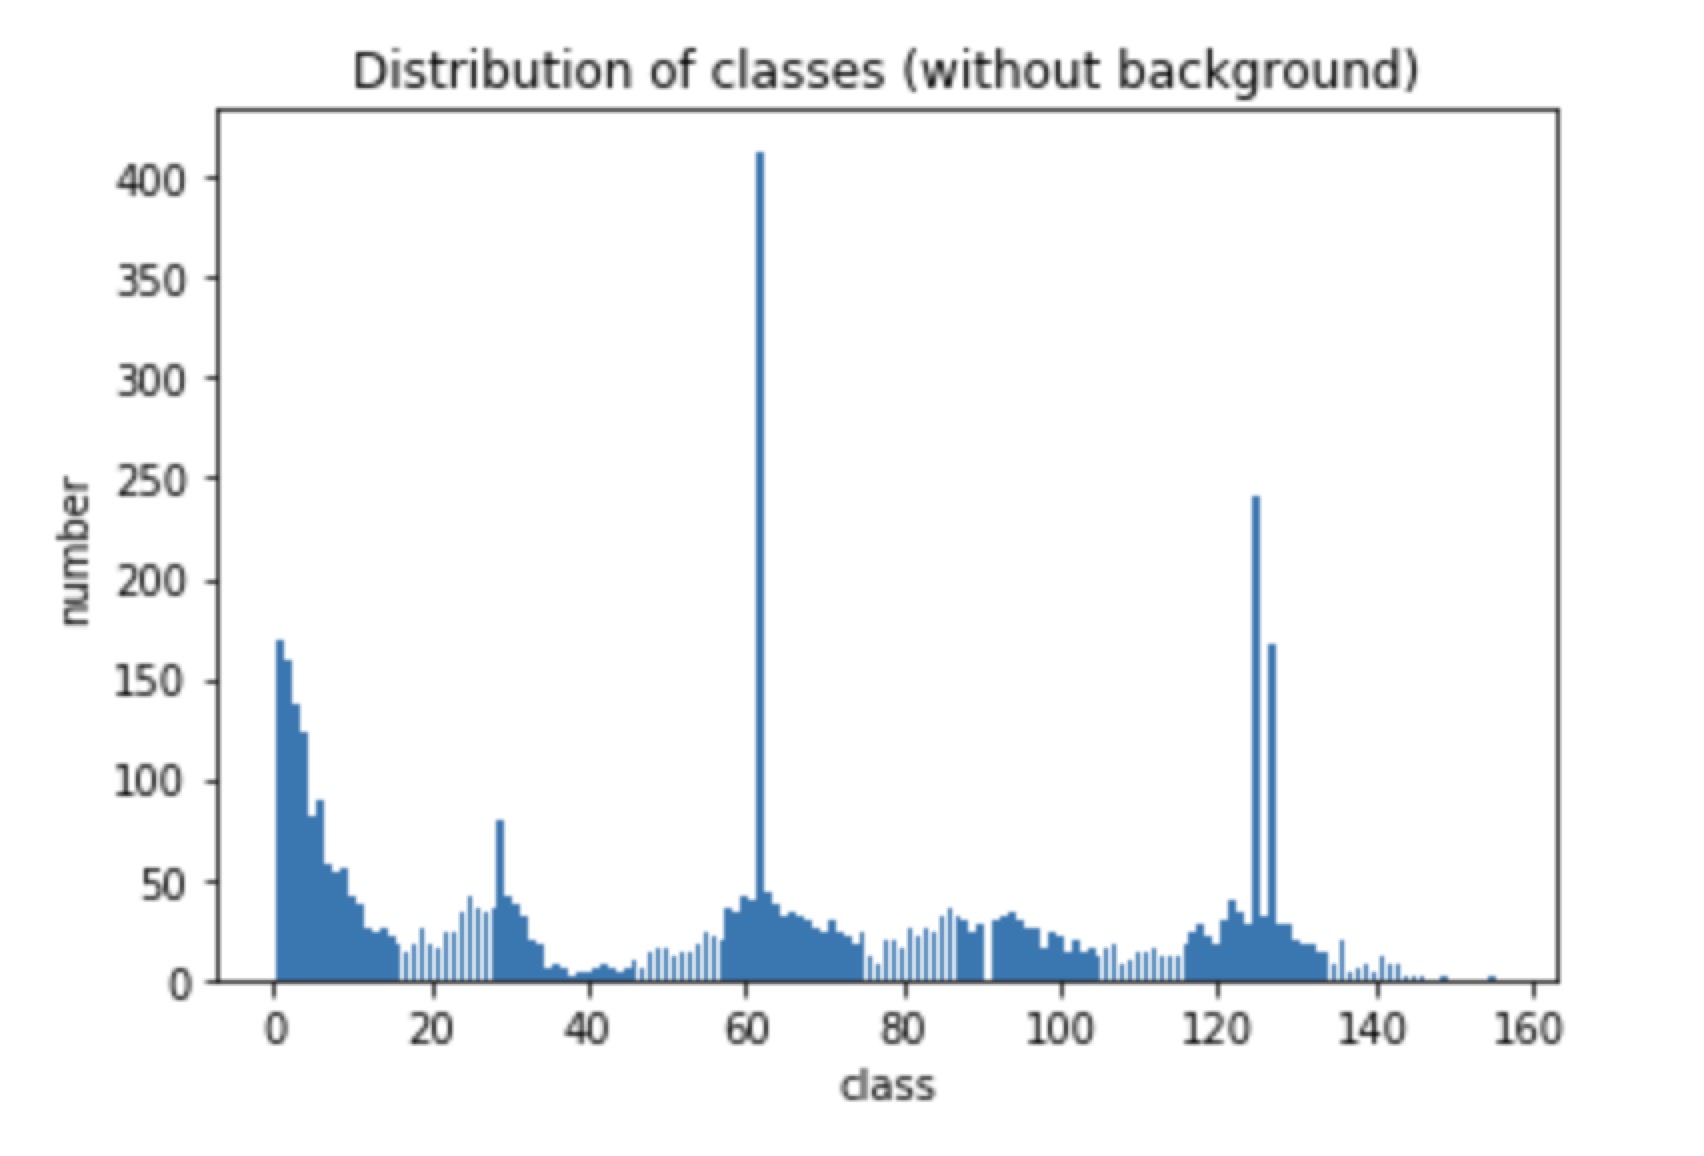
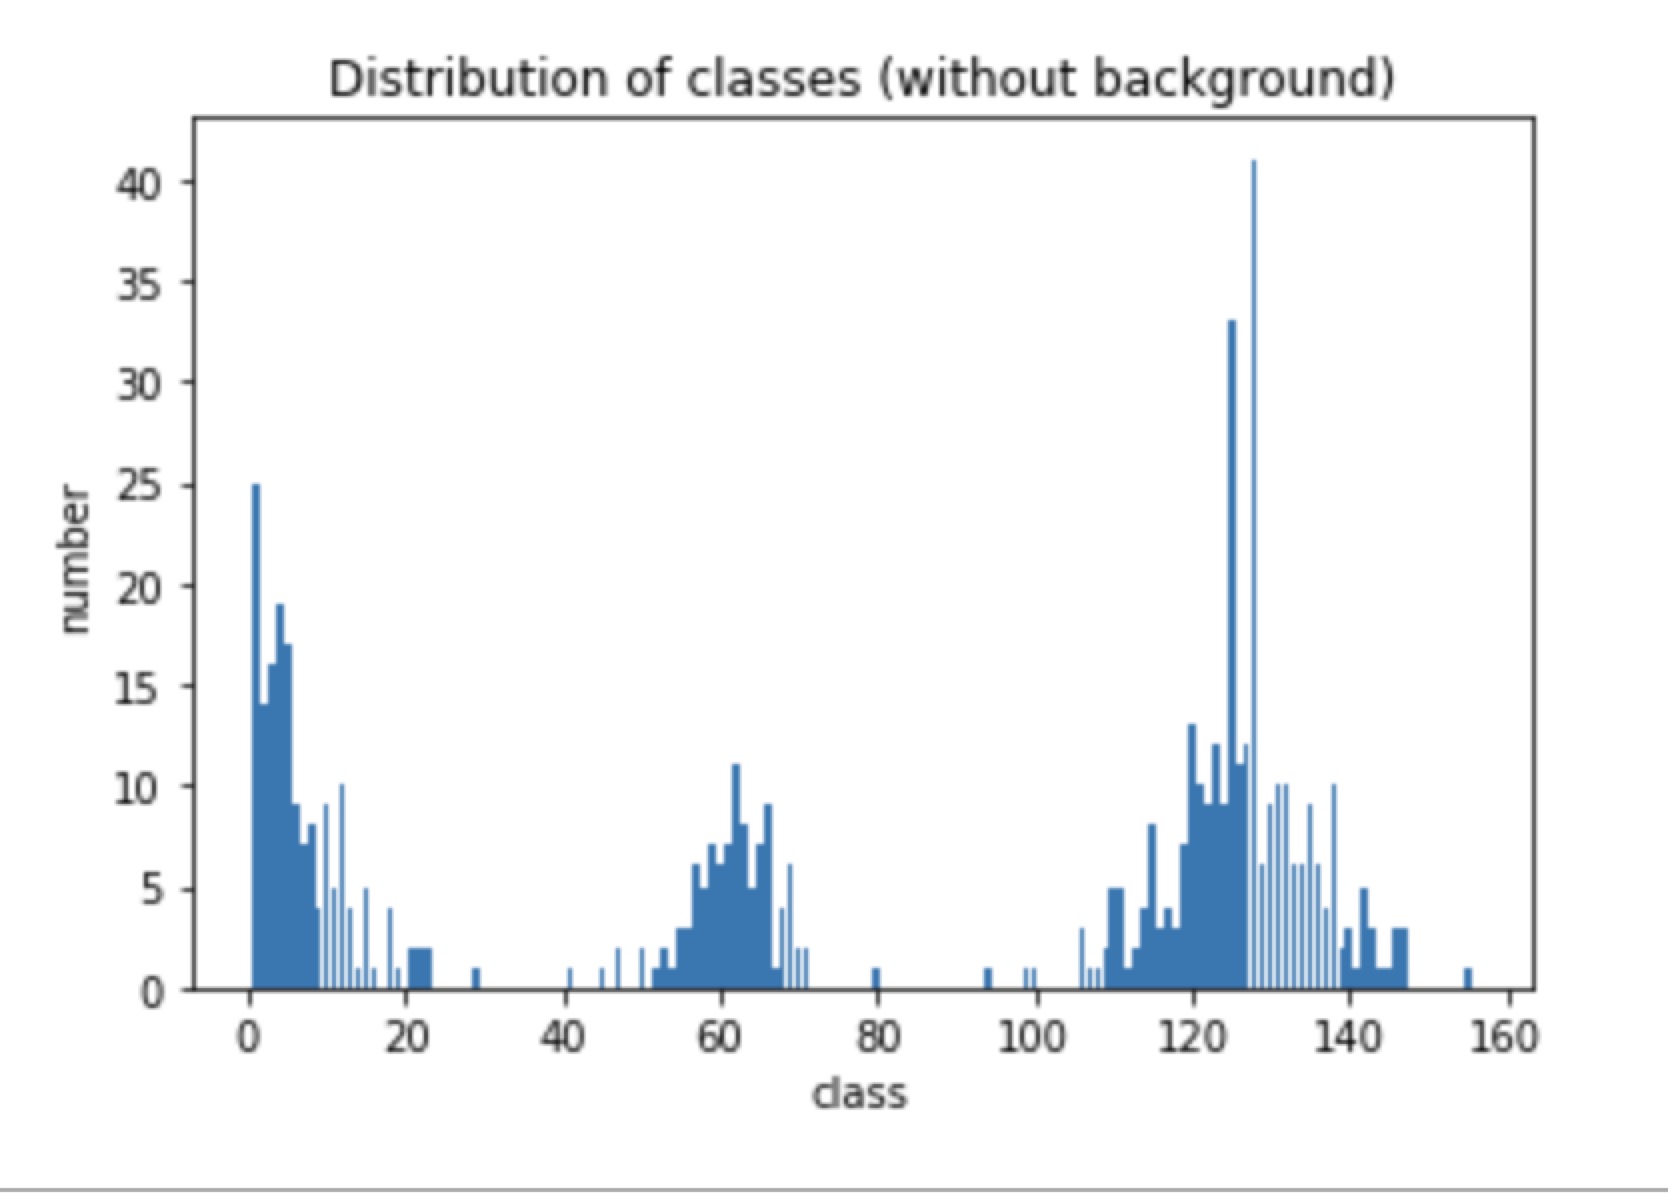
25 Feb 2019For slice 4 and slice 5, The loss doesn’t decrease. Observing the unique values in mask, I find that the number of unique values for slice 4 and slice 5 is more average, i.e. The difference in the number of different classes is small. One example for instance: one parc_1 unique color number in slice 4:


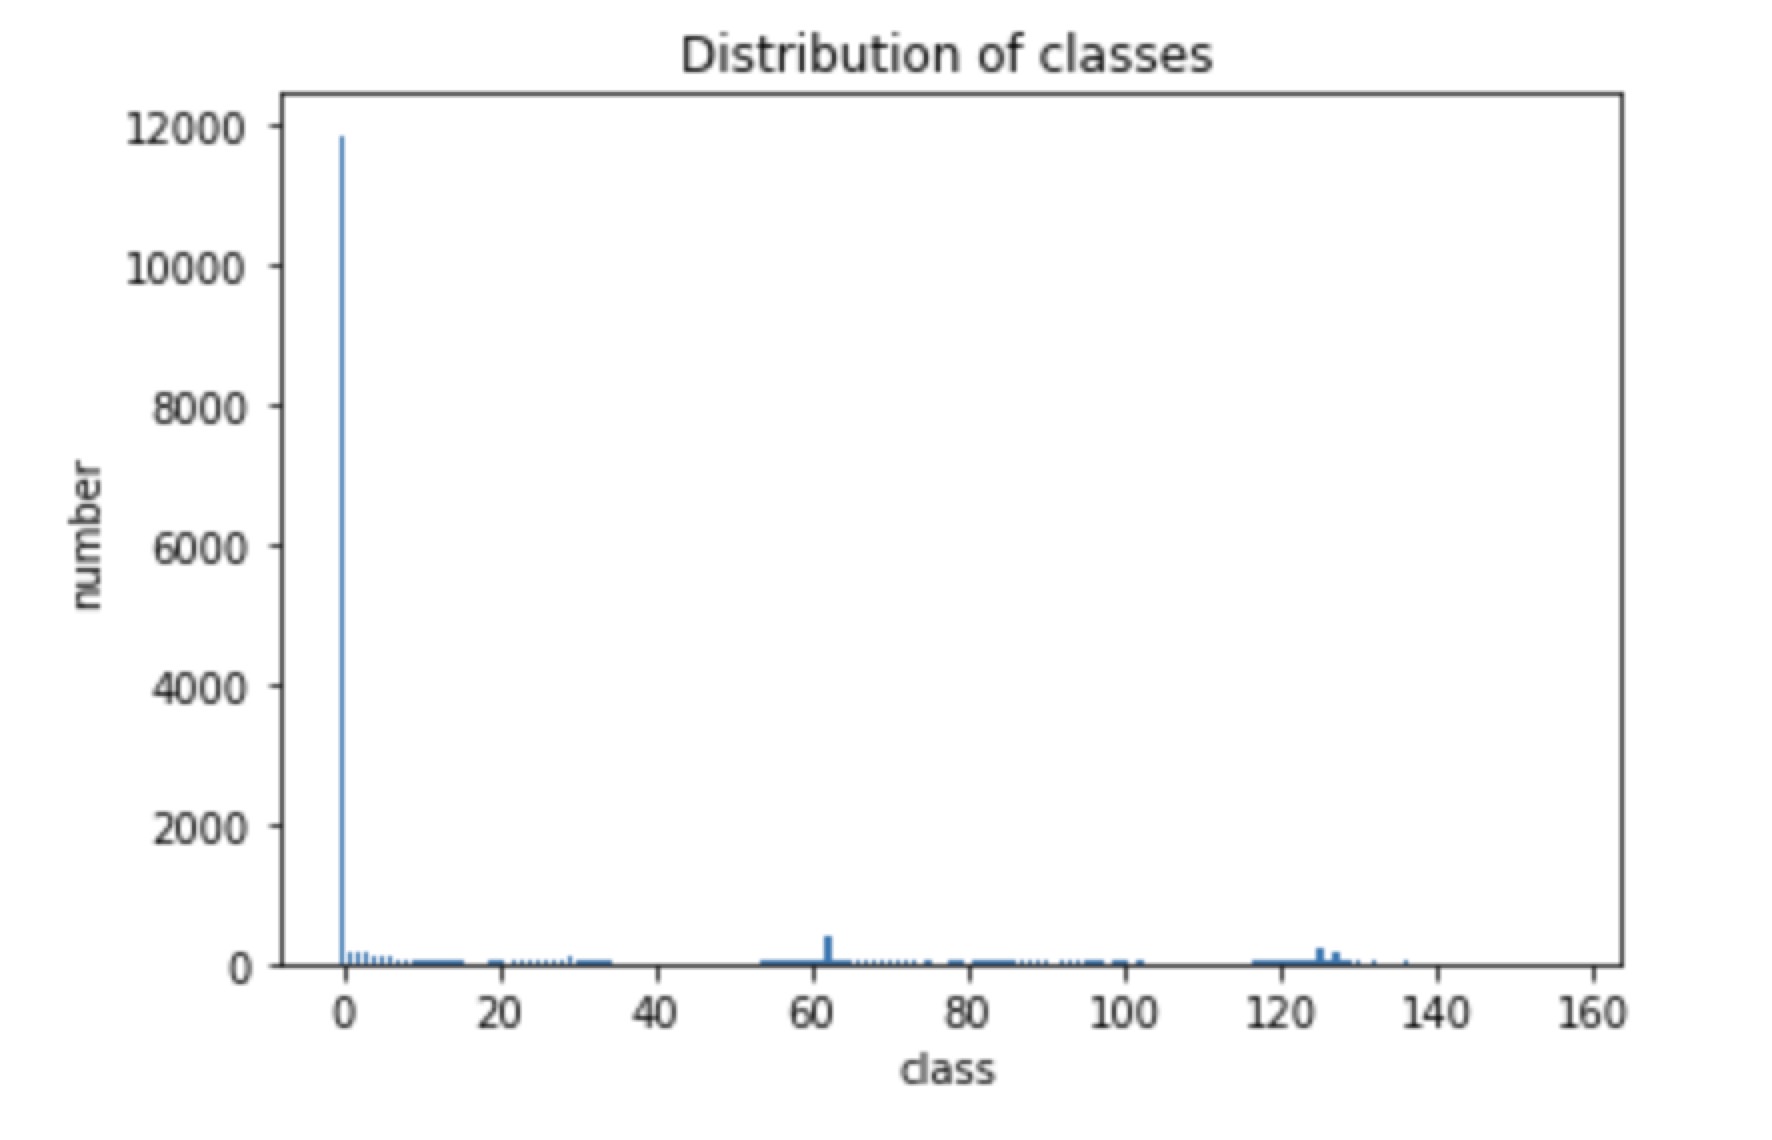
While for slice 1, the class distribution is:

So to deal with the class imbalance, we should assign weight to these class labels. I initially considered to add weight to the dataloader but since the sampler can only be a sequence, where in our case is a 2 dimensional tensor, an alternative choice which is to add weight to NLLloss() directly is chosen.
Calculate the total frequency for axial plane
For axial plane, the unique colour and their frequency are illustrated as follows, this first tensor represents the class frequency, where we can notice that 0 is the most frequent appearance class label, it represents the background.
[841437103  10250923   7549988   6202351   5479058   4958986   4507302
   4243786   3792552   3194501   2646184   2244682   1963318   1780359
   1661430   1592262   1547413   1525394   1493846   1440255   1356328
   1244865   1128676   1056876    964887    916613    856547    815654
    780511    759421    728968    671533    613634    543049    480876
    436910    410222    371976    339930    299092    296347    269747
    261126    362197    274102    240017    232081    224661    226577
    229913    239052    260643    287046    323339    368924    429290
    475533    550669    628456    701645    794142    882573   3357467
    988450    989575    979536    989692    988891   1002396    996119
   1010202   1002309   1002004   1000883    993450    989924    985237
    976607    966696    958122    946667    935270    919341    904095
    891085    871166    852290    837076    802372    778569    750211
    732621    699185    662531    627733    586727    560334    542006
    522943    502830    491130    455715    446945    388742    361932
    415303    323668    286551    273422    261092    249175    248550
    249064    255377    267272    279651    297206    316893    333156
    349060    363610    415263    427623    432991   2650231    666910
   1237103    465004    361275    328196    296866    274032    245754
    211556    192685    161724    134744    115166     98740     80831
     67831     56935     46194     38591     31462     26456     20272
     18050     13141     10713      7724      6303      4786      3788
      2820      1950      2069      1372       936       668       628
       347       329       174       125        68        41        42
        22        11         4         1         1         3         4
         9         8         1]

[  0.   1.   2.   3.   4.   5.   6.   7.   8.   9.  10.  11.  12.  13.
  14.  15.  16.  17.  18.  19.  20.  21.  22.  23.  24.  25.  26.  27.
  28.  29.  30.  31.  32.  33.  34.  35.  36.  37.  38.  39.  40.  41.
  42.  43.  44.  45.  46.  47.  48.  49.  50.  51.  52.  53.  54.  55.
  56.  57.  58.  59.  60.  61.  62.  63.  64.  65.  66.  67.  68.  69.
  70.  71.  72.  73.  74.  75.  76.  77.  78.  79.  80.  81.  82.  83.
  84.  85.  86.  87.  88.  89.  90.  92.  93.  94.  95.  96.  97.  98.
  99. 100. 101. 102. 103. 104. 105. 106. 107. 108. 109. 110. 111. 112.
 113. 114. 115. 116. 117. 118. 119. 120. 121. 122. 123. 124. 125. 126.
 127. 128. 129. 130. 131. 132. 133. 134. 135. 136. 137. 138. 139. 140.
 141. 142. 143. 144. 145. 146. 147. 148. 149. 150. 151. 152. 153. 154.
 155. 156. 157. 158. 159. 160. 161. 162. 163. 164. 165. 166. 167. 168.
 169. 170. 171. 172. 173. 174. 175. 176. 177. 180.]
Obeserving the results, we found that there are in total 178 classes for axial plane, with class label from 0 to 177, additional 180, excluding 91. Since form the dataloader the target label shouldn’t exceed the class number, so a class mapping is added, which map 180 to 91. so the final count is :
[841437103  10250923   7549988   6202351   5479058   4958986   4507302
   4243786   3792552   3194501   2646184   2244682   1963318   1780359
   1661430   1592262   1547413   1525394   1493846   1440255   1356328
   1244865   1128676   1056876    964887    916613    856547    815654
    780511    759421    728968    671533    613634    543049    480876
    436910    410222    371976    339930    299092    296347    269747
    261126    362197    274102    240017    232081    224661    226577
    229913    239052    260643    287046    323339    368924    429290
    475533    550669    628456    701645    794142    882573   3357467
    988450    989575    979536    989692    988891   1002396    996119
   1010202   1002309   1002004   1000883    993450    989924    985237
    976607    966696    958122    946667    935270    919341    904095
    891085    871166    852290    837076    802372    778569    750211
         1    732621    699185    662531    627733    586727    560334
    542006    522943    502830    491130    455715    446945    388742
    361932    415303    323668    286551    273422    261092    249175
    248550    249064    255377    267272    279651    297206    316893
    333156    349060    363610    415263    427623    432991   2650231
    666910   1237103    465004    361275    328196    296866    274032
    245754    211556    192685    161724    134744    115166     98740
     80831     67831     56935     46194     38591     31462     26456
     20272     18050     13141     10713      7724      6303      4786
      3788      2820      1950      2069      1372       936       668
       628       347       329       174       125        68        41
        42        22        11         4         1         1         3
         4         9         8]
The weight is calculated weight = 1. / count.float()
Adding the weight to NLLloss, the loss doesn’t decrease as the same for the slice 0. Since in slice 0, most pixels are background. So the loss observed before might just represent the background.
Moreover, training cross subject may lead to inference in loss decrease process. Some sudden increase of loss has been observed.
I have trained the network on slice 0, slice 5 respectively, and with 10, 20, 50 training images respectively. The loss decrease as desired. With network’s parameter num = 13,177,026