Week #17
18 Feb 2019Divide the axial planes slices into 18 groups
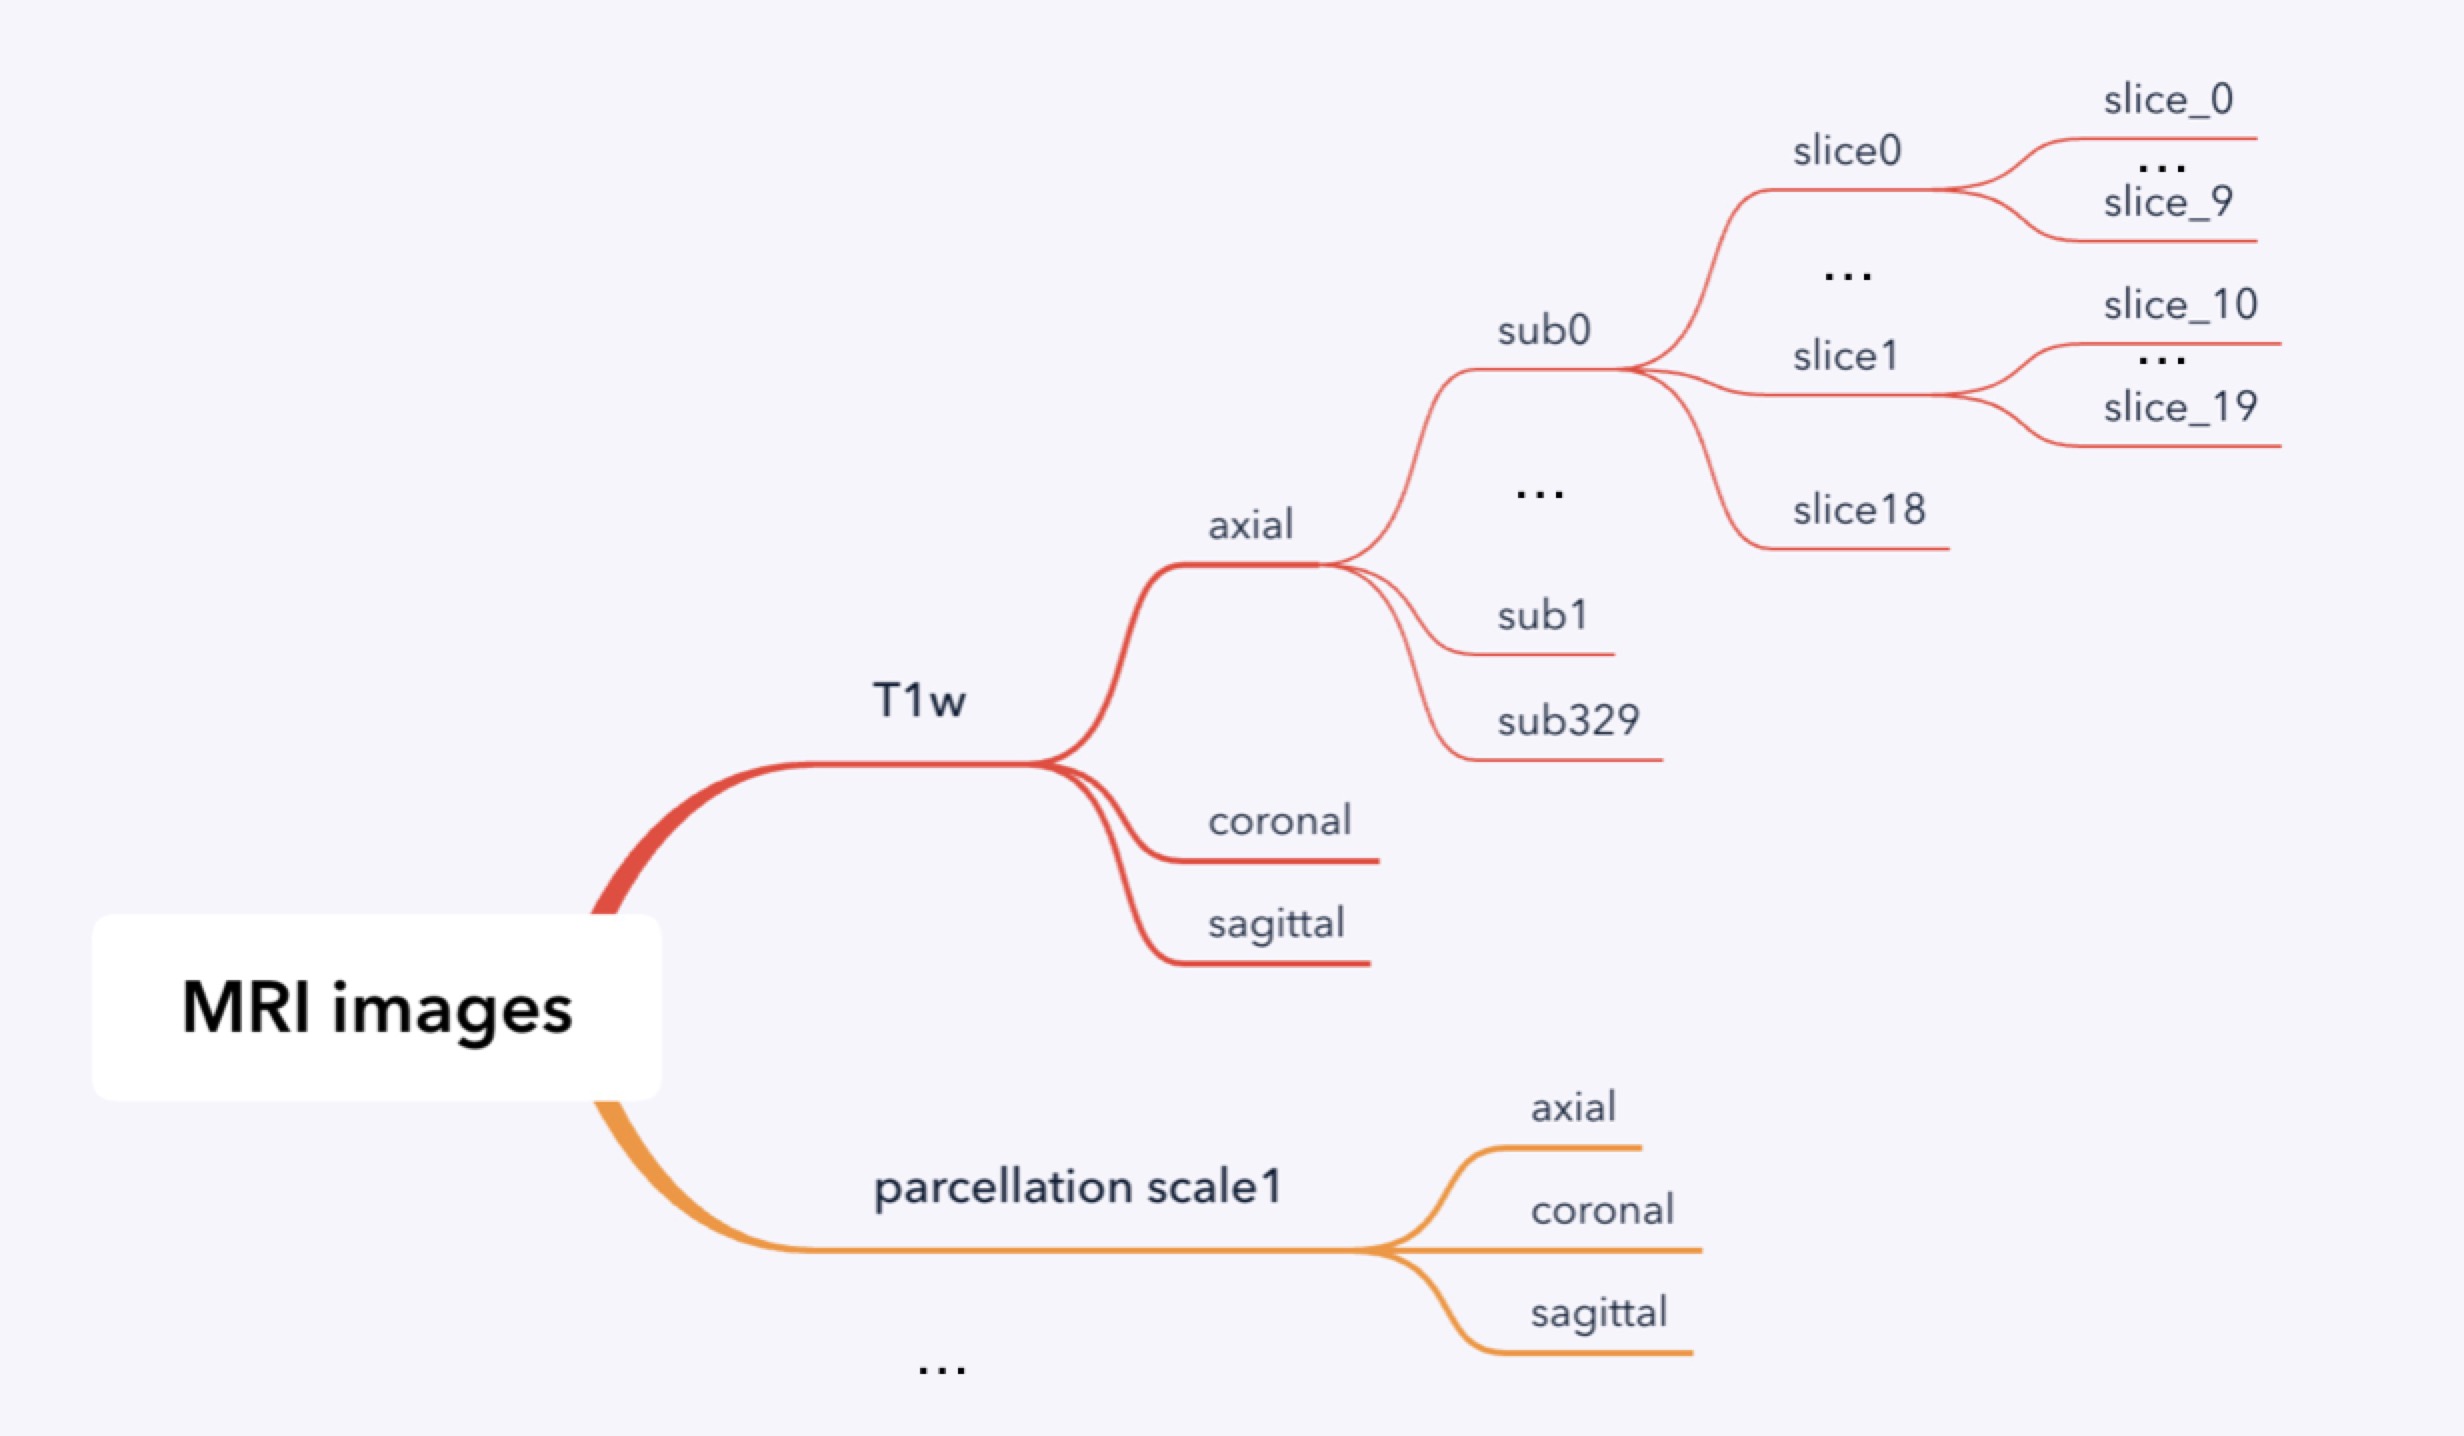
Data in slices
| Slice num | Class Num | Class labels |
| 0 | 167 | 0-165,167,168,169 except 86,91 |
| 1 | 172 | 0-171,177 no 91 |
| 2 | 174 | 0-175,176 except 91 |
| 3 | 174 | 0-173,176 except 91 |
| 4 | 175 | 0-171,174,176,177,180 except 91 |
| 5 | 171 | 0-169,174,177 except 91 |
| 6 | 170 | 0-170 except 91 |
| 7 | 168 | 0-169 except 91 |
| 8 | 153 | 0-151,155,156 except 91 |
| 9 | 145 | 0-144,146 except 91 |
| 10 | 135 | 0-135,137 except 91,131 |
| 11 | 129 | 0-127,129,130 except 91 |
| 12 | 125 | 0-124,126 no 91 |
| 13 | 123 | 0-120, 122, 126, 128 no 91 |
| 14 | 117 | 0-116,118, no 91 |
| 15 | 97 | 0-102,104,109 no 32,34,36,37,38,40,41,91 |
| 16 | 1 | 0 |
| 17 | 1 | 0 |
| 18 | 1 | 0 |
| total | 178 | 0-177,180, no 91 |
From the table above, we observe that there are in total 178 different class labels for axial plane, so the network is defined to have 178 classes as output.
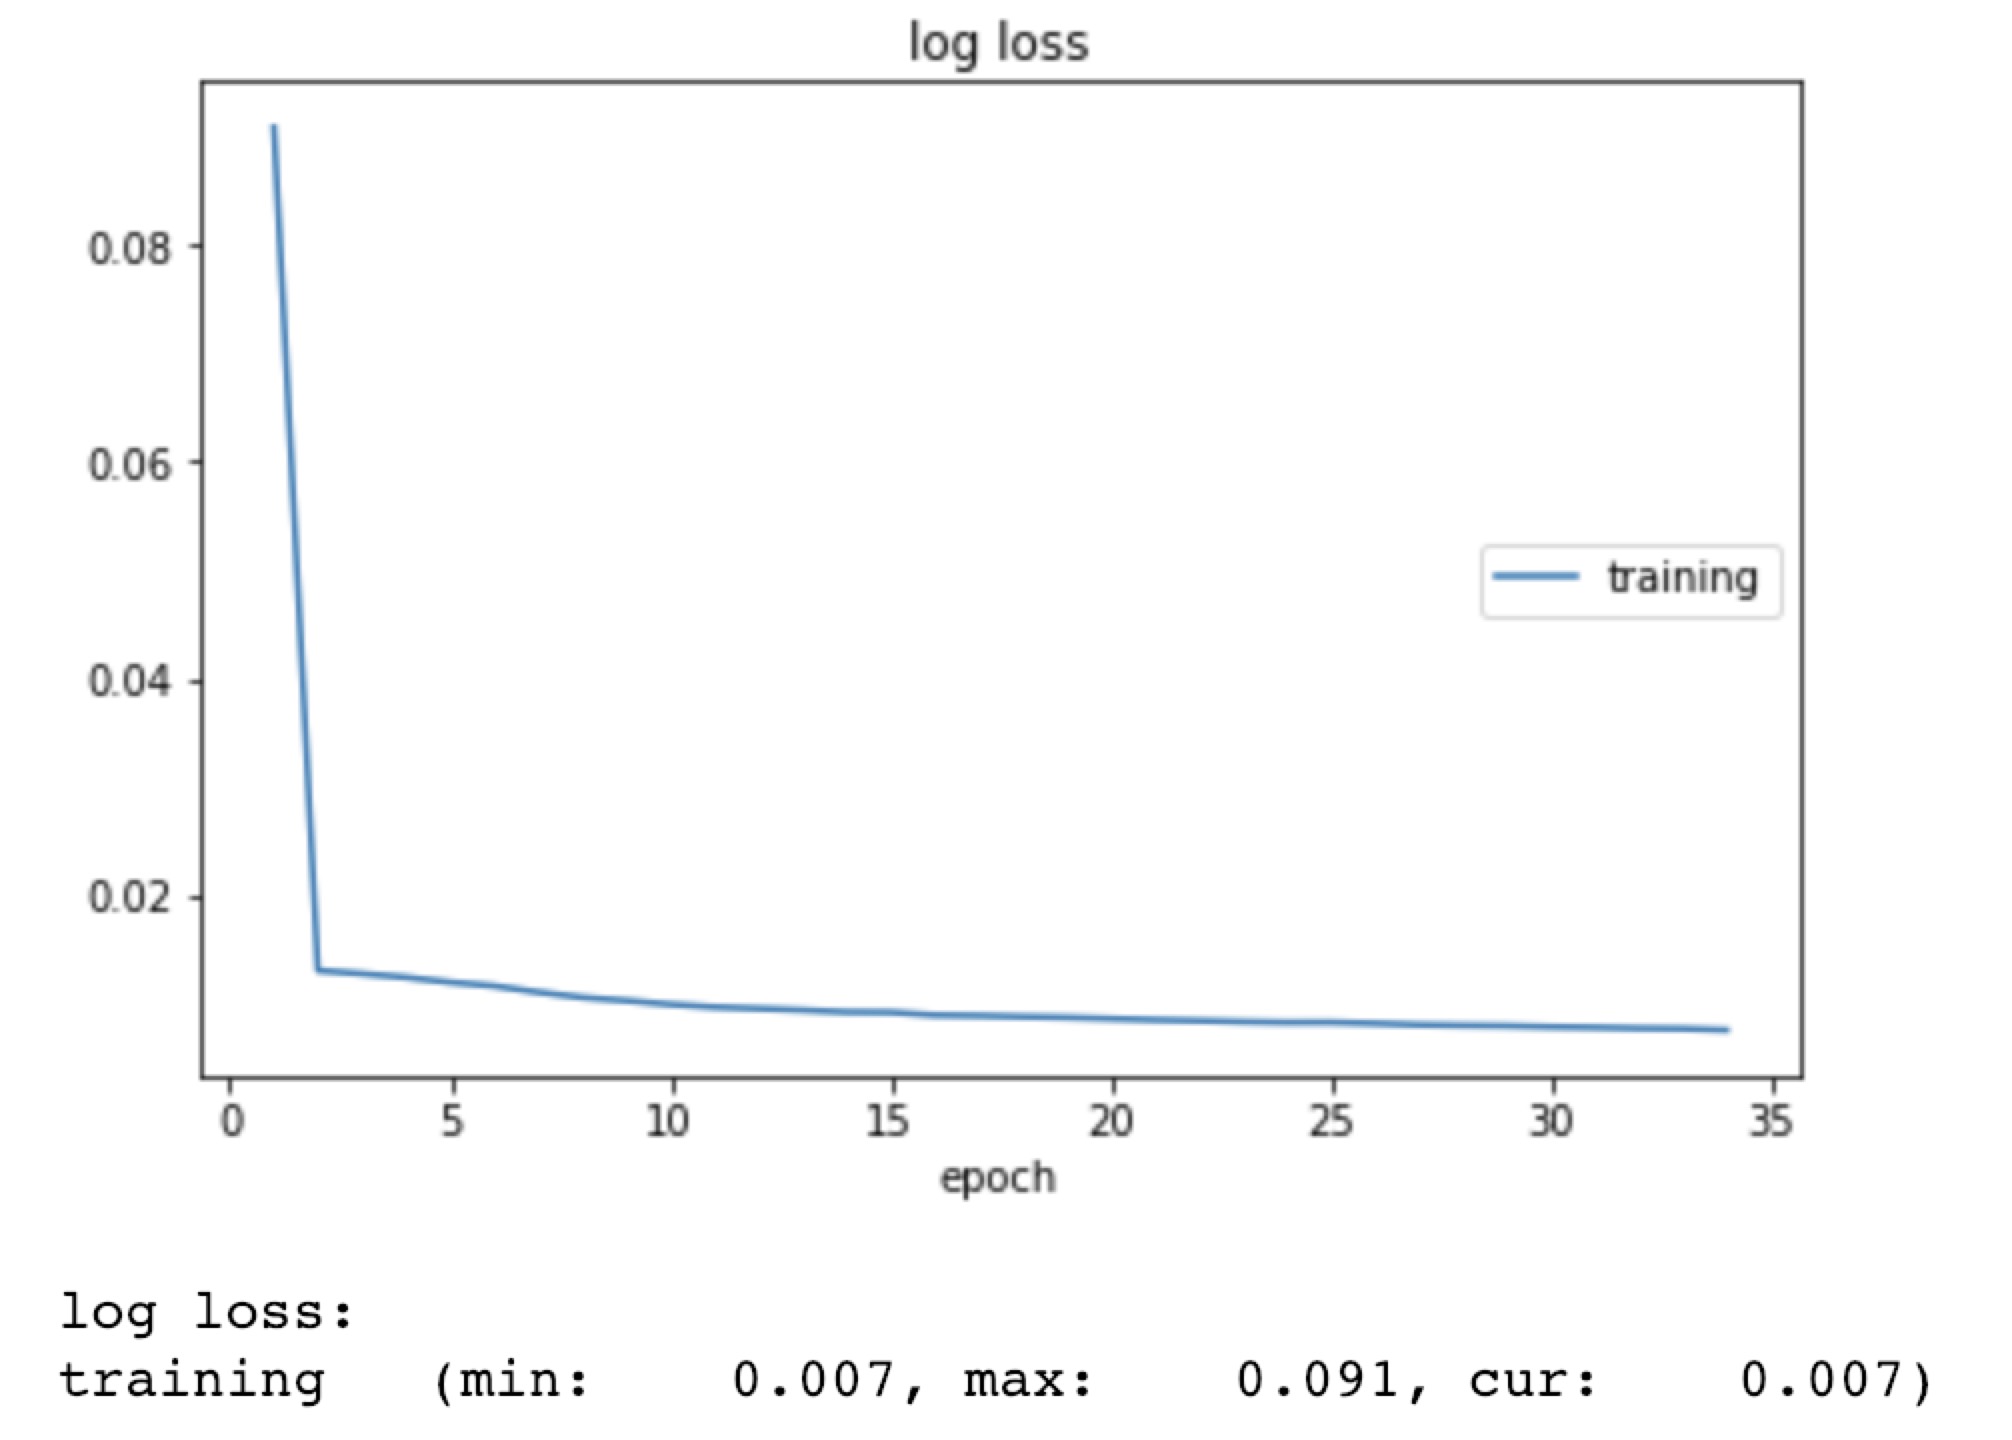
Training on slice0, where there are 3330 images in total, with 3,303,618 the loss could reach 0.007 within 35 epochs. The loss is represented in the figure below.
Parc_1 experiments
| Slice Idx | training subjects | slice per subjects | total images | image size | learing rate | optimization | Paremeters | Batch size | epoch | minimum loss reached |
| 0 | 330 | 10 | 3300 | 128x128 | 0.001 | Adam | 3,303,618 | 5 | 35 | 0.007 |
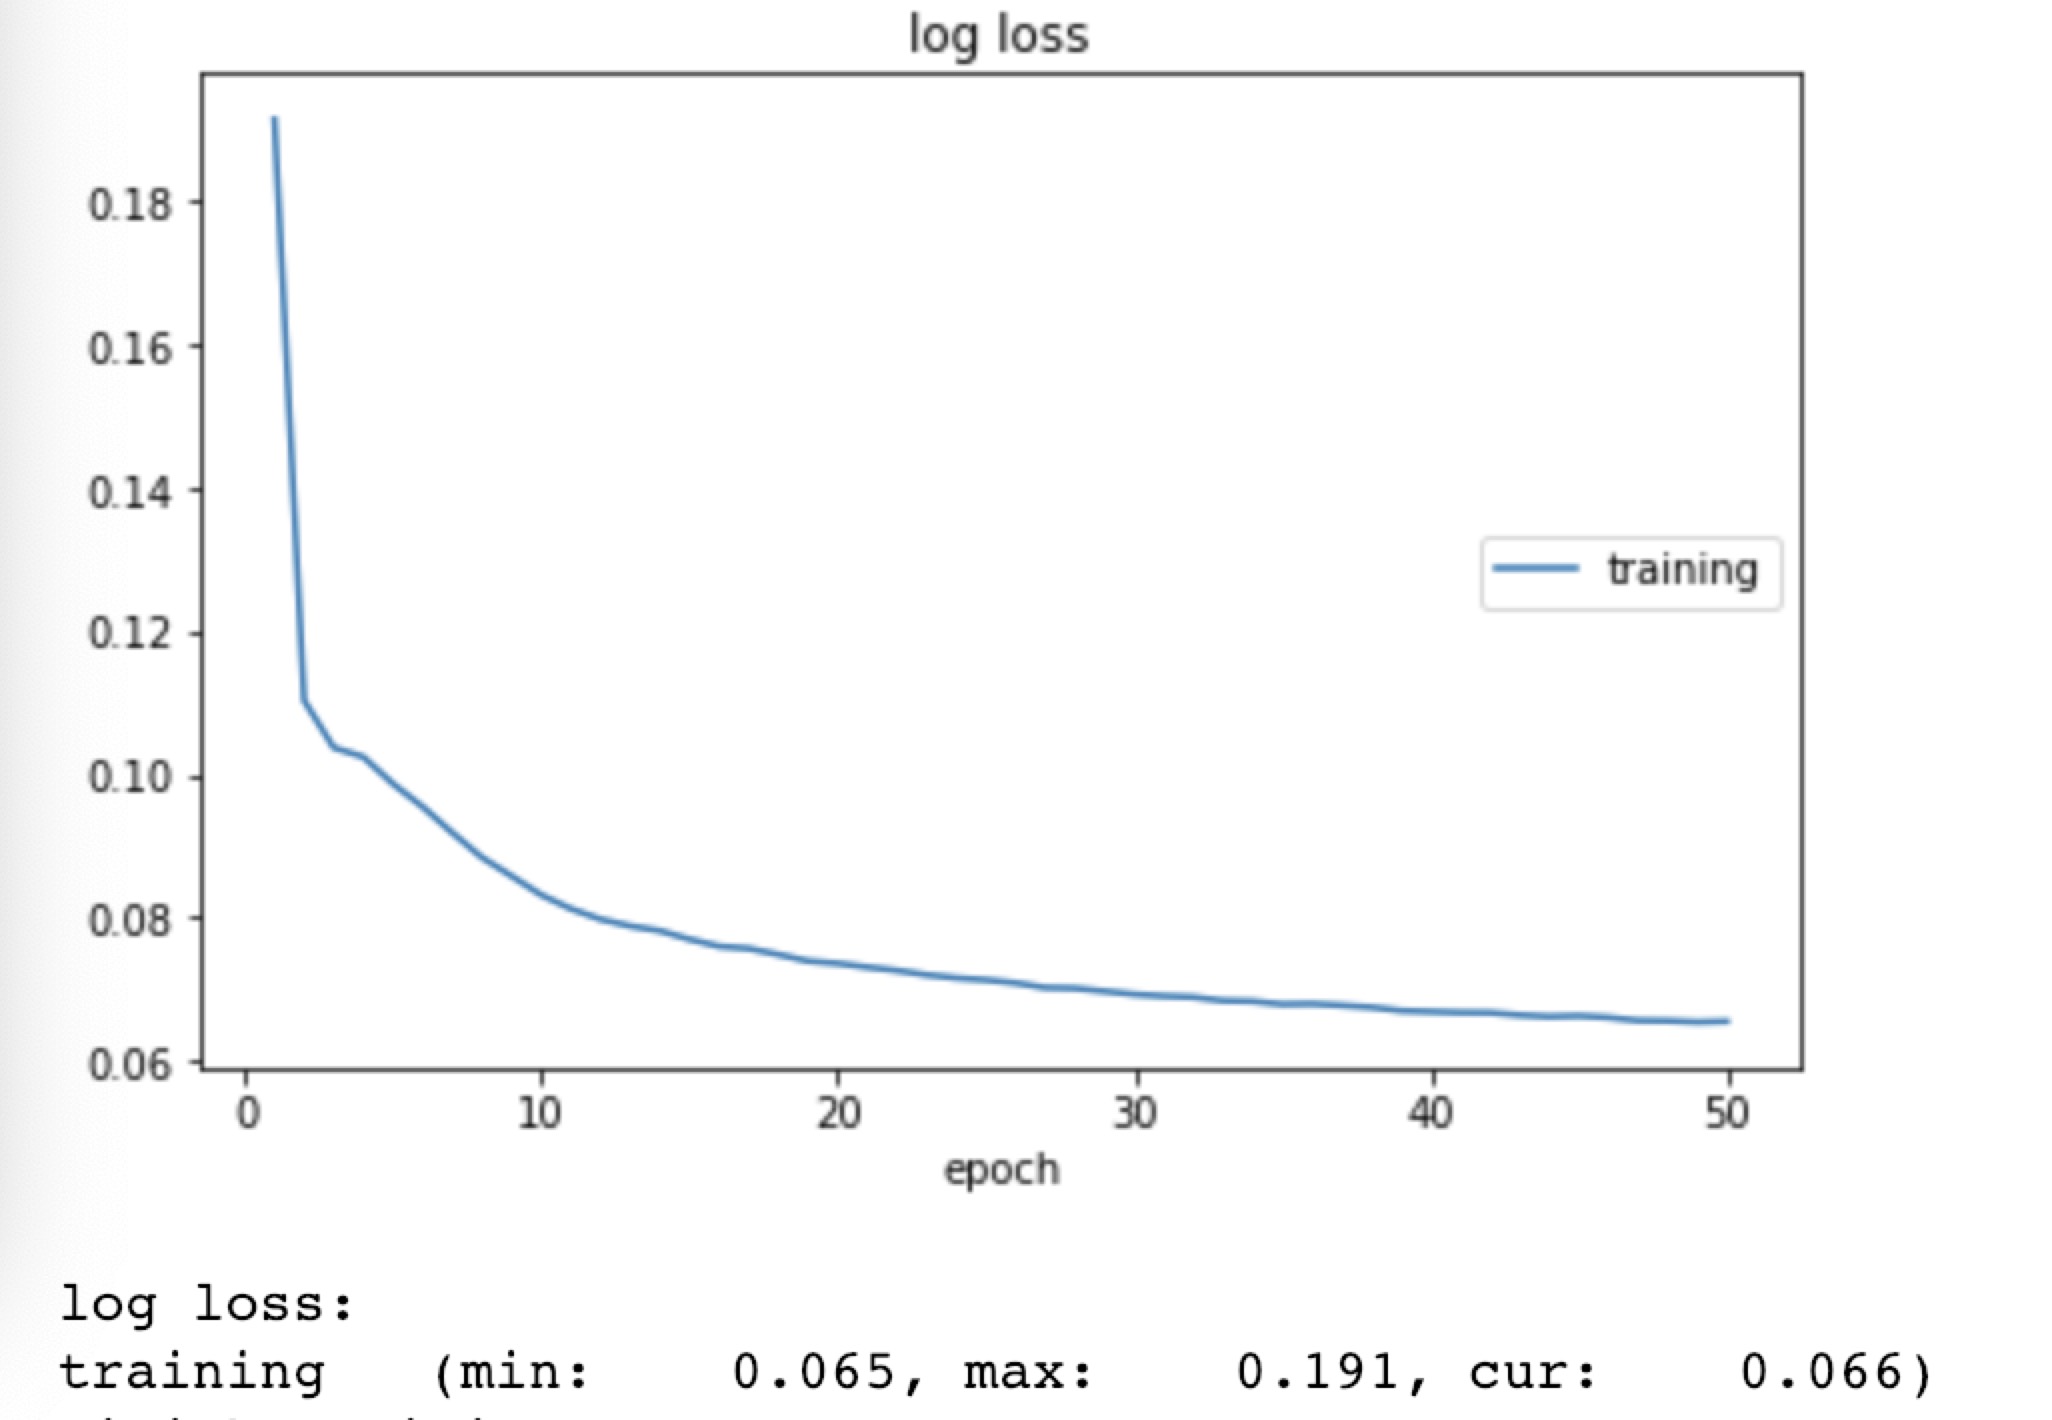
| 1 | 330 | 10 | 3300 | 128x128 | 0.001 | Adam | 3,303,618 | 5 | 50 | 0.066 |
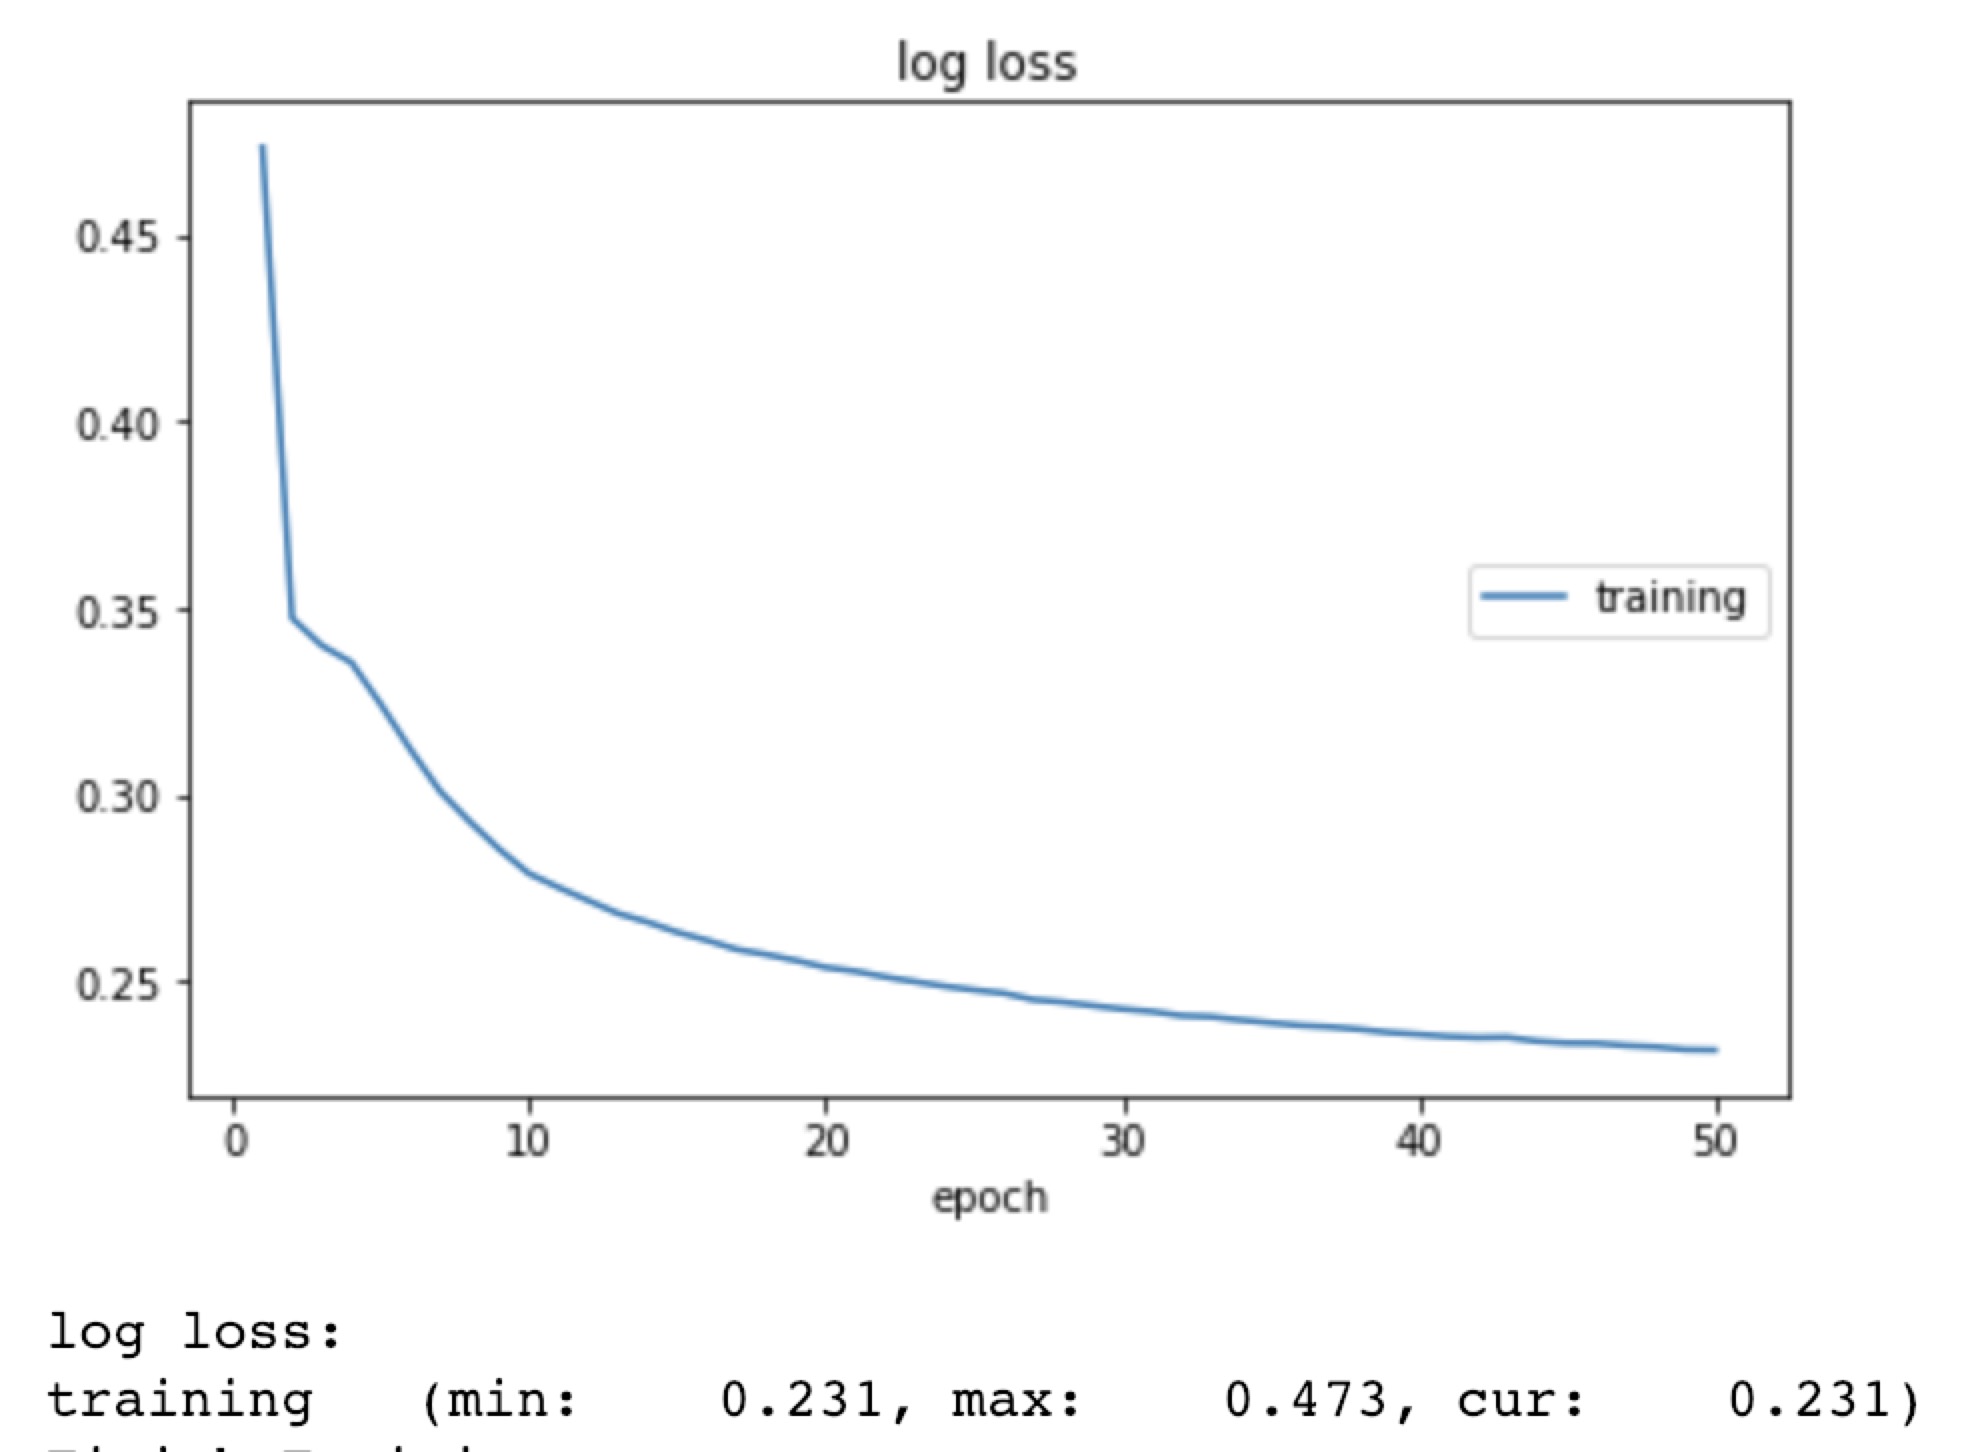
| 1,2 | 330 | 10 | 6600 | 128x128 | 0.001 | Adam | 3,303,618 | 5 | 50 | 0.231 |
| 2 | 330 | 10 | 3300 | 128x128 | 0.001 | Adam | 3,303,618 | 50 | 50 | 0.242 |
| 3 | 330 | 10 | 3300 | 128x128 | 0.001 | Adam | 3,303,618 | 10 | 50 | 0.533 |
I have done an experiments using these slide group by group. Batch size=50. parameter size 3,303,618 Here are the results:
| slicegroup | epoch0 loss | epoch50 loss |
| 0 | 0.802 | 0.008 |
| 1 | 0.121 | 0.069 |
| 2 | 0.361 | 0.235 |
| 3 | 0.729 | 0.540 |
| 4 | 1.001 | 0.771 |
| 5 | 1.363 | 1.088 |
| 6 | 1.516 | 1.287 |
| 7 | 1.415 | 1.234 |
| 8 | 1.274 | 1.099 |
| 9 | 1.107 | 0.939 |
| 10 | 1.094 | 0.936 |
| 11 | 0.956 | 0.832 |
| 12 | 0.684 | 0.584 |
| 13 | 0.339 | 0.256 |
| 14 | 0.063 | 0.032 |
Decrease learning rate every 30 epochs: